
Class 10 SELINA Solutions Maths Chapter 24 - Measures of Central Tendency (Mean, Median, Quartiles and Mode)
Get through the solutions of the chapter -Measures of Central Tendency - Mean, Median, Quartiles, and Mode with the best Selina Solutions forICSE Class 10 Math.
This ICSE Class 10 Maths chapter goes deep into statistics and offers details regarding data analysis and visualisation. You will learn about the key ideas of mean, median, quartiles, and mode, as well as how to use these concepts as means of analysing and interpreting data sets.
Equipped with Selina Solutions designed for ICSE Class 10 Maths, you may easily navigate through this chapter. Our detailed explanations and well-organised solutions provide you with a firm understanding of the ideas. Our solutions improve your understanding, whether you're figuring out the mean as the arithmetic average or investigating quartiles to grasp data dispersion.
Why Choose Selina Solutions?
- Total Coverage: Our Selina Solutions cover every aspect of "Measures of Central Tendency," exploring every idea.
- Conceptual Clarity: Our user-friendly explanations make complicated statistical terminology obvious, so you can completely understand the concepts.
- Exam Excellence: Prepare yourself with the resources required to perform well on tests. Our answers provide lots of practice, helping you improve your test preparedness and problem-solving abilities.
Strengthen Your Understanding On Statistics
Numerous disciplines, ranging from economics to science and beyond, rely extensively on statistics. By understanding "Measures of Central Tendency," you're laying the foundation for further academic work and practical applications.
Simply click to obtain the Selina Solutions for ICSE Class 10 Maths chapter "Measures of Central Tendency - Mean, Median, Quartiles, and Mode." As you make your way through this statistical journey, prepare yourself with knowledge, conciseness, and confidence. Let Selina Solutions help you show the way to academic success in statistics.
Measures of Central Tendency (Mean, Median, Quartiles and Mode) Exercise Ex. 24(A)
Solution 1
(i)

(ii)

Solution 2
(a) Here n = 9

(b)
If marks of each student be increased by 4 then new arithmetic mean will be = 59 + 4 = 63
Solution 3
Numbers between 3 to 12 are 3, 4, 5, 6, 7, 8, 9, 10, 11 and 12.
Here n = 10

Solution 4
(a) The mean of 7, 11, 6, 5 and 6
![]()
(b)
If we subtract 2 from each number, then the mean will be 7-2 = 5
Solution 5
No. of terms = 5
Mean = 8
Sum of numbers = 8 x 5 = 40 .(i)
But, sum of numbers = 6+4+7+a+10 = 27+a ..(ii)
From (i) and (ii)
27+a = 40
a = 13
Solution 6
No. of terms = 5 and mean = 8
Sum of numbers = 5 x 8 = 40 ..(i)
but sum of numbers = 6+y+7+x+14 = 27+y+x .(ii)
from (i) and (ii)
27 + y + x = 40
x + y = 13
y = 13 - x
Solution 7
|
Age in yrs xi |
Frequency (fi) |
fixi |
|
12 |
2 |
24 |
|
13 |
4 |
52 |
|
14 |
6 |
84 |
|
15 |
9 |
135 |
|
16 |
8 |
128 |
|
17 |
7 |
119 |
|
18 |
4 |
72 |
|
Total |
40 |
614 |

Solution 8
No. of terms = 10
Mean = 69.5
Sum of the numbers = 69.5 x 10 = 695 ..........(i)
But sum of numbers = 72+70+x+62+ 50+71+90+64+58+82
= 619 + x ......(ii)
from (i) and (ii)
619 + x = 695
x = 76
Solution 9
|
Height (cm) xi |
No. of Plants fi |
fixi |
|
50 |
2 |
100 |
|
55 |
4 |
220 |
|
58 |
10 |
580 |
|
60 |
f |
60f |
|
65 |
5 |
325 |
|
70 |
4 |
280 |
|
71 |
3 |
213 |
|
Total |
28+f |
1718 + 60f |
Mean = 60.95

Solution 10
|
Wages (Rs/day) (x) |
No. of Workers (f) |
fx |
|
50 |
2 |
100 |
|
60 |
4 |
240 |
|
70 |
8 |
560 |
|
80 |
12 |
960 |
|
90 |
10 |
900 |
|
100 |
6 |
600 |
|
Total |
42 |
3360 |

(i) Mean remains the same if the number of workers in each category is doubled.
Mean = 80
(ii) Mean will be increased by 60% if the wages per day per worker is increased by 60%
New mean = ![]()
(iii) No change in the mean if the number of workers is doubled but if wages per worker is reduced by 40%, then
New mean = ![]()
Solution 11
|
No. of matches (x) |
No. of boxes (f) |
fx |
|
35 |
6 |
210 |
|
36 |
10 |
360 |
|
37 |
18 |
666 |
|
38 |
25 |
950 |
|
39 |
21 |
819 |
|
40 |
12 |
480 |
|
41 |
8 |
328 |
|
Total |
100 |
3813 |
(i) 
(ii) In the second case,
New mean = 39 matches
Total contents = 39 x 100 = 3900
But total number of matches already given = 3813
Number of new matches to be added = 3900 - 3813 = 87
Solution 12

Solution 13

Solution 14

Solution 15

Measures of Central Tendency (Mean, Median, Quartiles and Mode) Exercise Ex. 24(B)
Solution 1
|
Age in years C.I. |
xi |
Number of students (fi) |
xifi |
|
16 - 18 |
17 |
2 |
34 |
|
18 - 20 |
19 |
7 |
133 |
|
20 - 22 |
21 |
21 |
441 |
|
22 - 24 |
23 |
17 |
391 |
|
24 - 26 |
25 |
3 |
75 |
|
Total |
|
50 |
1074 |

Solution 2
(i) Direct Method
|
Weekly Wages (Rs) |
Mid-Value xi |
No. of Workers (fi) |
fixi |
|
50-55 |
52.5 |
5 |
262.5 |
|
55-60 |
57.5 |
20 |
1150.0 |
|
60-65 |
62.5 |
10 |
625.0 |
|
65-70 |
67.5 |
10 |
675.0 |
|
70-75 |
72.5 |
9 |
652.5 |
|
75-80 |
77.5 |
6 |
465.0 |
|
80-85 |
82.5 |
12 |
990.0 |
|
85-90 |
87.5 |
8 |
700.0 |
|
Total |
|
80 |
5520.00 |

(ii) Short - cut method
|
Weekly wages (Rs) |
No. of workers (fi) |
Mid-value xi |
A = 72.5 di=x-A |
fidi |
|
50-55 |
5 |
52.5 |
-20 |
-100 |
|
55-60 |
20 |
57.5 |
-15 |
-300 |
|
60-65 |
10 |
62.5 |
-10 |
-100 |
|
65-70 |
10 |
67.5 |
-5 |
-50 |
|
70-75 |
9 |
A=72.5 |
0 |
0 |
|
75-80 |
6 |
77.5 |
5 |
30 |
|
80-85 |
12 |
82.5 |
10 |
120 |
|
85-90 |
8 |
87.5 |
15 |
120 |
|
Total |
80 |
|
|
-280 |

Solution 3
(i) Short - cut method
|
Marks |
No. of boys (fi) |
Mid-value xi |
A = 65 di=x-A |
fidi |
|
30 - 40 |
10 |
35 |
-30 |
-300 |
|
40 - 50 |
12 |
45 |
-20 |
-240 |
|
50 - 60 |
14 |
55 |
-10 |
-140 |
|
60 - 70 |
12 |
A = 65 |
0 |
0 |
|
70 - 80 |
9 |
75 |
10 |
90 |
|
80 - 90 |
7 |
85 |
20 |
140 |
|
90 - 100 |
6 |
95 |
30 |
180 |
|
Total |
70 |
|
|
-270 |

(ii) Step - deviation method
|
Marks |
No. of boys (fi) |
Mid-value xi |
A = 65
|
fiui |
|
30 - 40 |
10 |
35 |
-3 |
-30 |
|
40 - 50 |
12 |
45 |
-2 |
-24 |
|
50 - 60 |
14 |
55 |
-1 |
-14 |
|
60 - 70 |
12 |
A = 65 |
0 |
0 |
|
70 - 80 |
9 |
75 |
1 |
9 |
|
80 - 90 |
7 |
85 |
2 |
14 |
|
90 - 100 |
6 |
95 |
3 |
18 |
|
Total |
70 |
|
|
-27 |

Here A = 65 and h = 10

Solution 4
|
C. I. |
Frequency (fi) |
Mid-value xi |
A = 87.50
|
fiui |
|
63 - 70 |
9 |
66.50 |
-3 |
-27 |
|
70 - 77 |
13 |
73.50 |
-2 |
-26 |
|
77 - 84 |
27 |
80.50 |
-1 |
-27 |
|
84 - 91 |
38 |
A = 87.50 |
0 |
0 |
|
91 - 98 |
32 |
94.50 |
1 |
32 |
|
98 - 105 |
16 |
101.50 |
2 |
32 |
|
105 - 112 |
15 |
108.50 |
3 |
45 |
|
Total |
150 |
|
|
29 |

Here A = 87.50 and h = 7

Solution 5
![]()
|
C. I. |
frequency |
Mid-value (xi) |
fixi |
|
0-10 |
8 |
5 |
40 |
|
10-20 |
22 |
15 |
330 |
|
20-30 |
31 |
25 |
775 |
|
30-40 |
f |
35 |
35f |
|
40-50 |
2 |
45 |
90 |
|
Total |
63+f |
|
1235+35f |

Solution 6
Let the assumed mean A= 72.5
|
C.I |
fi |
Mid value (xi) |
di=xi -; A |
fidi |
|
50-55 |
5 |
52.5 |
-20 |
-100 |
|
55-60 |
20 |
57.5 |
-15 |
-300 |
|
60-65 |
10 |
62.5 |
-10 |
-100 |
|
65-70 |
10 |
67.5 |
-5 |
-50 |
|
70-75 |
9 |
72.5 |
0 |
0 |
|
75-80 |
6 |
77.5 |
5 |
30 |
|
80-85 |
12 |
82.5 |
10 |
120 |
|
85-90 |
8 |
87.5 |
15 |
120 |
|
Total |
80 |
|
-280 |
|

Solution 7
|
C.I. |
Frequency |
Mid value x |
fx |
|
15-25 |
10 |
20 |
200 |
|
25-35 |
20 |
30 |
600 |
|
35-45 |
25 |
40 |
1000 |
|
45-55 |
15 |
50 |
750 |
|
55-65 |
5 |
60 |
300 |
|
Total |
75 |
|
2850 |

Solution 8
|
Class |
Frequency (f) |
Mid Value (x) |
fx |
|
0 - 20 |
7 |
10 |
70 |
|
20 - 40 |
p |
30 |
30p |
|
40 - 60 |
10 |
50 |
500 |
|
60 - 80 |
9 |
70 |
630 |
|
80 - 100 |
13 |
90 |
1170 |
|
Total |
39 + p |
2370 + 30p |

Here mean = 54 ..(ii)
from (i) and (ii)

Solution 9
|
Class |
Freq (f) |
Mid value |
fx |
|
0-20 |
5 |
10 |
50 |
|
20-40 |
f1 |
30 |
30f1 |
|
40-60 |
10 |
50 |
500 |
|
60-80 |
f2 |
70 |
70f2 |
|
80-100 |
7 |
90 |
630 |
|
100-120 |
8 |
110 |
880 |
|
Total |
30+f1+f2 |
|
2060+30f1+70f2 |
Now,  and
and
![]()
![]()
from (i)
![]()
using (i) and (ii)

Solution 10

Measures of Central Tendency (Mean, Median, Quartiles and Mode) Exercise Ex. 24(C)
Solution 1
Arranging the given data in descending order:
8, 7, 6, 5, 4, 3, 3, 1, 0
The middle term is 4 which is the 5th term.
Median = 4
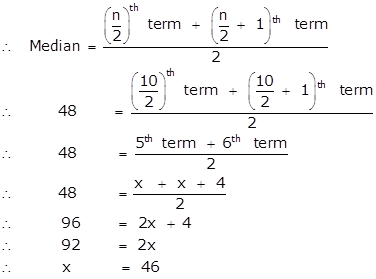
Solution 2
Arranging the given data in descending order:
28.5, 28, 27.5, 25.5, 24, 24, 22, 21, 21, 20.5
The middle terms are 24 and 24, 5th and 6th terms
![]()
Solution 3
Arranging in ascending order:
22, 24, 25, 26, 26, 27, 27, 28, 28, 29, 21, 32, 32, 33, 35, 35, 36, 36, 37
(i) Middle term is 10th term i.e. 29
Median = 29
(ii) Lower quartile =

(iii) Upper quartile =

(iv) Interquartile range = q3 - q1 =35 - 26 = 9
Solution 4
Arrange in ascending order:
0, 7, 10, 18, 25, 36, 38, 40, 45, 56, 60, 65, 77, 83, 88, 95
(i) Median is the mean of 8th and 9th term
![]()
(ii) Upper quartile =

(iii) Interquartile range =

Solution 5
|
Age (in years) |
Frequency |
Cumulative Frequency |
|
11 |
2 |
2 |
|
12 |
4 |
6 |
|
13 |
6 |
12 |
|
14 |
10 |
22 |
|
15 |
8 |
30 |
|
16 |
7 |
37 |
Number of terms = 37
Median = 
Median = 14
Solution 6
|
Weight (kg) x |
no. of boys f |
cumulative frequency |
|
37 |
10 |
10 |
|
38 |
14 |
24 |
|
39 |
18 |
42 |
|
40 |
12 |
54 |
|
41 |
6 |
60 |
Number of terms = 60
(i) median = the mean of the 30th and the 31st terms

(ii)
lower quartile (Q1) = ![]()
(iii)
upper quartile (Q3) = ![]()
(iv) Interquartile range = Q3 - Q1 = 40 - 38 = 2
Solution 7
|
Class |
Frequency |
Cumulative Frequency |
|
0-10 |
4 |
4 |
|
10-20 |
9 |
13 |
|
20-30 |
15 |
28 |
|
30-40 |
14 |
42 |
|
40-50 |
8 |
50 |
Number of terms = 50

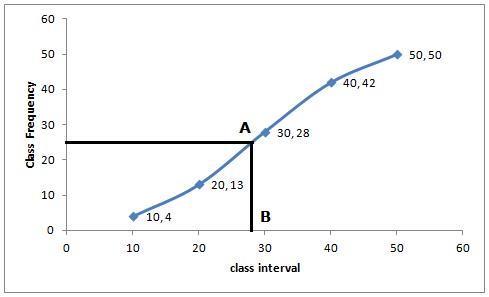
Through mark of 25.5 on the y-axis, draw a line parallel to x-axis which meets the curve at A. From A, draw a perpendicular to x-axis, which meets x-axis at B.
The value of B is the median which is 28.
Solution 8
|
Weight (kg) |
No. of boys |
Cumulative Frequency |
|
10-15 |
11 |
11 |
|
15-20 |
25 |
36 |
|
20-25 |
12 |
48 |
|
25-30 |
5 |
53 |
|
30-35 |
2 |
55 |
Number of terms = 55

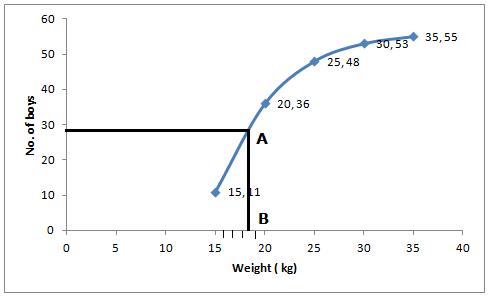
Through mark of 28 on the y-axis, draw a line parallel to x-axis which meets the curve at A. From A, draw a perpendicular to x-axis, which meets x-axis at B.
The value of B is the median which is 18.4 kg
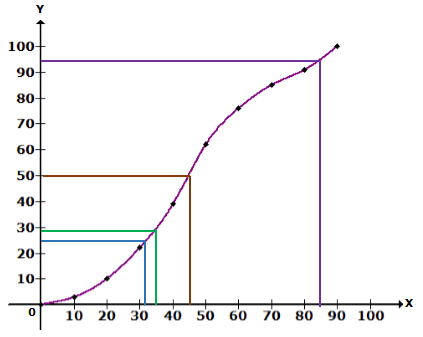
Solution 9
|
Marks (less than) |
Cumulative frequency |
|
10 |
5 |
|
20 |
24 |
|
30 |
37 |
|
40 |
40 |
|
50 |
42 |
|
60 |
48 |
|
70 |
70 |
|
80 |
77 |
|
90 |
79 |
|
100 |
80 |
Number of terms = 80
\Median = 40th term.
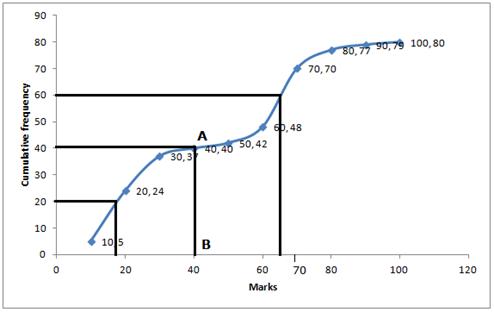
(i) Median = Through 40th term mark draw a line parallel to the x-axis which meets the curve at A. From A, draw a perpendicular to x-axis which meets it at B.
Value of B is the median = 40
(ii) Lower quartile (Q1) = 20th term = 18
(iii) Upper Quartile (Q3) = 60th term = 66
Solution 10
|
Height (in cm) |
No. of pupils |
Cumulative Frequency |
|
121 - 130 |
12 |
12 |
|
131 - 140 |
16 |
28 |
|
141 - 150 |
30 |
58 |
|
151 - 160 |
20 |
78 |
|
161 - 170 |
14 |
92 |
|
171 - 180 |
8 |
100 |
Number of terms = 100

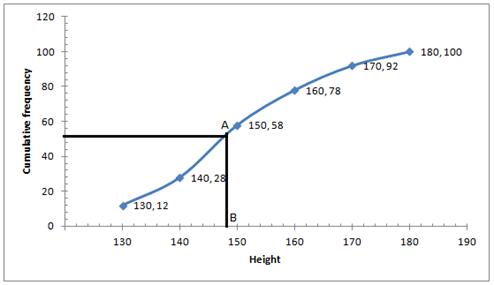
Through 50th term mark draw a line parallel to the x-axis which meets the curve at A. From A, draw a perpendicular to x-axis which meets it at B.
Value of B is the median = 148
 Median height = 148cm
Measures of Central Tendency (Mean, Median, Quartiles and Mode) Exercise Ex. 24(D)
Solution 1
(i) Mode = 7
Since 7 occurs 4 times
(ii) Mode = 11
Since it occurs 4 times
Solution 2
Mode is 122 cm because it occur maximum number of times. i.e. frequency is 18.
Solution 3
Mode is in 20-30, because in this class there are 20 frequencies.
Solution 4
Mode is in 30-35 because it has the maximum frequency.
Solution 5
![]() which is 5.
which is 5.
Mode = 5 because it occurs maximum number of times.
Solution 6
Arranging the given data in ascending order:
7, 10, 12, 12, 14, 15, 16, 16, 16, 17, 19
(i) Mode = 16 as it occurs maximum number of times.
(ii) ![]()
(iii)Total marks = 7+10+12+12+14+15+16+16+16+17+19 =
154
(iv) ![]()
Solution 7
(i)![]()
(ii) Median = mean of 8th and 9th term
![]()
(iii) Mode = 5 as it occurs maximum number of times.
Solution 8
|
Score x |
No. of shots f |
fx |
|
0 |
0 |
0 |
|
1 |
3 |
3 |
|
2 |
6 |
12 |
|
3 |
4 |
12 |
|
4 |
7 |
28 |
|
5 |
5 |
25 |
|
Total |
25 |
80 |
(i) Modal score = 4 as it has maximum frequency 7.
(ii) 
(iii) Total score = 80
(iv) ![]()
Measures of Central Tendency (Mean, Median, Quartiles and Mode) Exercise Ex. 24(E)
Solution 1
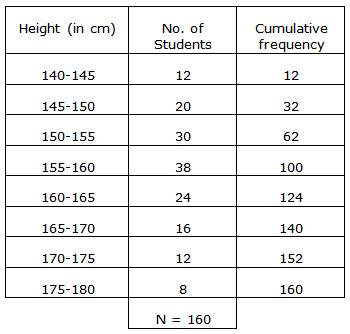
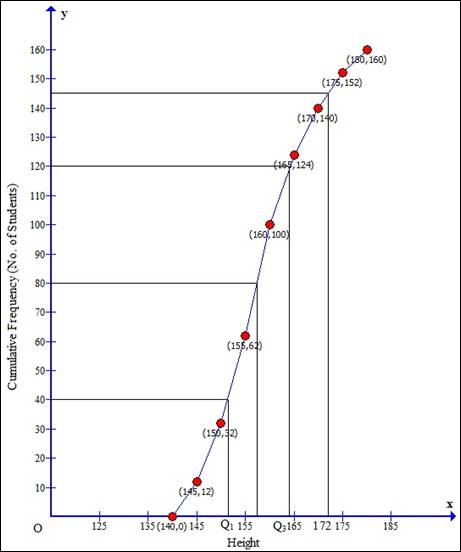
Taking Height of student along x-axis and cumulative frequency along y-axis we will draw an ogive.
(i)
![]()
Through mark for 80, draw a parallel line to x-axis which meets the curve; then from the curve draw a vertical line which meets the x-axis at the mark of 157.5.
(ii)Since, number of terms = 160

(iii)Through mark for 172 on x-axis, draw a vertical line which meets the curve; then from the curve draw a horizontal line which meets the y-axis at the mark of 145.
The number of students whose height is above 172 cm
= 160 - 144 = 16
Solution 2
|
Marks |
No. of students |
Cumulative frequency |
|
9.5 - 19.5 |
14 |
14 |
|
19.5 - 29.5 |
16 |
30 |
|
29.5 - 39.5 |
22 |
52 |
|
39.5 - 49.5 |
26 |
78 |
|
49.5 - 59.5 |
18 |
96 |
|
59.5 - 69.5 |
11 |
107 |
|
69.5 - 79.5 |
6 |
113 |
|
79.5 - 89.5 |
4 |
117 |
|
89.5 - 99.5 |
3 |
120 |
Scale:
1cm = 10 marks on X axis
1cm = 20 students on Y axis
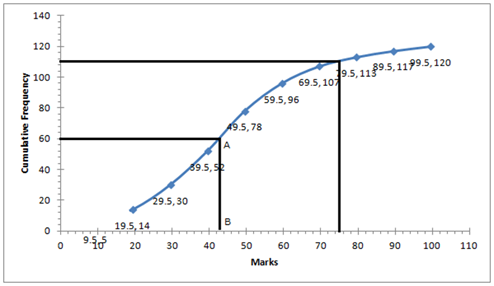
(i) ![]()
Through mark 60, draw a parallel line to x-axis which meets the curve at A. From A, draw a perpendicular to x-axis meeting it at B.
The value of point B is the median = 43
(ii) Total marks = 100
75% of total
marks = ![]() marks
marks
The number of students getting more than 75% marks = 120 - 111 = 9 students.
Solution 3
Mean of 1, 7, 5, 3, 4 and 4 = ![]()
 m=4
m=4
Now, mean of 3, 2, 4, 2, 3, 3 and p = m-1 = 4-1 = 3
Therefore, 17+p = 3 x n …. Where n = 7
17+p = 21
p = 4
Arranging in ascending order:
2, 2, 3, 3, 3, 3, 4, 4
Mean = 4th term = 3
Therefore, q = 3
Solution 4
|
Date |
Number |
C.f. |
|
1 |
5 |
5 |
|
2 |
12 |
17 |
|
3 |
20 |
37 |
|
4 |
27 |
64 |
|
5 |
46 |
110 |
|
6 |
30 |
140 |
|
7 |
31 |
171 |
|
8 |
18 |
189 |
|
9 |
11 |
200 |
|
10 |
5 |
205 |
|
11 |
0 |
205 |
|
12 |
1 |
206 |
(i) Mode = 5th July as it has maximum frequencies.
(ii) Total number of terms = 206
Upper quartile = 
Lower quartile = ![]()
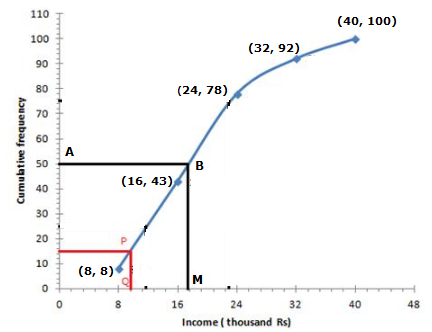
Solution 5

We plot the points (8, 8), (16, 43), (24, 78), (32, 92) and (40, 100) to get the curve as follows:
![]()
At y = 50, affix A.
Through A, draw a horizontal line meeting the curve at B.
Through B, a vertical line is drawn which meets OX at M.
OM = 17.6 units
Hence, median income = 17.6 thousands

Solution 6
Arranging the terms in ascending order:
2, 6, 8, 9, 10, 11, 11, 12, 13, 13, 14, 14, 15, 15, 15, 16, 16, 18, 19, 20
Number of terms = 20
![]()
(i) ![]()
(ii) ![]()
(iii) Mode = 15 as it has maximum frequencies i.e. 3
Solution 7
|
Marks |
No. of students |
c.f. |
|
0-10 |
5 |
5 |
|
10-20 |
9 |
14 |
|
20-30 |
16 |
30 |
|
30-40 |
22 |
52 |
|
40-50 |
26 |
78 |
|
50-60 |
18 |
96 |
|
60-70 |
11 |
107 |
|
70-80 |
6 |
113 |
|
80-90 |
4 |
117 |
|
90-100 |
3 |
120 |
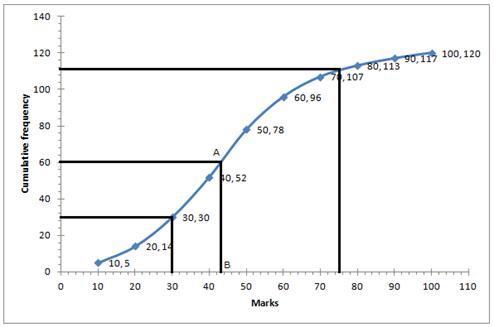
(i) ![]()
Through mark 60.5, draw a parallel line to x-axis which meets the curve at A, From A draw a perpendicular to x-axis meeting it at B.
The value of point B is the median = 43
(ii) Number of students who obtained up to 75% marks in the test = 110
Number of students who obtained more than 75% marks in the test = 120 - 110 = 10
(iii) Number of students who obtained less than 40% marks in the test = 52 (from the graph; x=40, y=52)
(iv) Lower quartile = Q1 = ![]()
Solution 8
|
Weight |
Frequency |
C. f. |
|
40-45 |
5 |
5 |
|
45-50 |
17 |
22 |
|
50-55 |
22 |
44 |
|
55-60 |
45 |
89 |
|
60-65 |
51 |
140 |
|
65-70 |
31 |
171 |
|
70-75 |
20 |
191 |
|
75-80 |
9 |
200 |
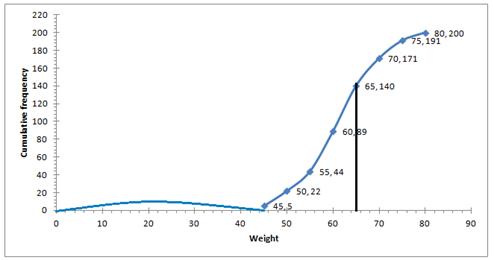
(i) Number of students weighing more than 55 kg = 200-44 = 156
Therefore, percentage of students weighing 55 kg or more
![]()
(ii) 30% of students = ![]()
Heaviest 60students in weight = 9 + 21 + 30 = 60
weight = 65 kg ( from table)
(iii) (a) underweight students when 55.70 kg is standard = 46 (approx) from graph
(b) overweight students when 55.70 kg is standard = 200- 55.70 = 154 (approx) from graph
Solution 9
|
Marks obtained(x) |
No. of students (f) |
c.f. |
fx |
|
5 |
3 |
3 |
15 |
|
6 |
9 |
12 |
54 |
|
7 |
6 |
18 |
42 |
|
8 |
4 |
22 |
32 |
|
9 |
2 |
24 |
18 |
|
10 |
1 |
25 |
10 |
|
Total |
25 |
171 |
Number of terms = 25
(i) Mean = 
(ii) ![]()
(iii) Mode = 6 as it has maximum frequencies i.e. 6
Solution 10
|
C.I. |
Frequency(f) |
Mid value (x) |
fx |
|
10-20 |
5 |
15 |
75 |
|
20-30 |
3 |
25 |
75 |
|
30-40 |
f |
35 |
35f |
|
40-50 |
7 |
45 |
315 |
|
50-60 |
2 |
55 |
110 |
|
60-70 |
6 |
65 |
390 |
|
70-80 |
13 |
75 |
975 |
|
Total |
36+f |
1940+35f |


Solution 11
|
Monthly Income (thousands) |
No. of employees (f) |
Cumulative frequency |
|
6-7 |
20 |
20 |
|
7-8 |
45 |
65 |
|
8-9 |
65 |
130 |
|
9-10 |
95 |
225 |
|
10-11 |
60 |
285 |
|
11-12 |
30 |
315 |
|
12-13 |
5 |
320 |
|
Total |
320 |
Number of employees = 320
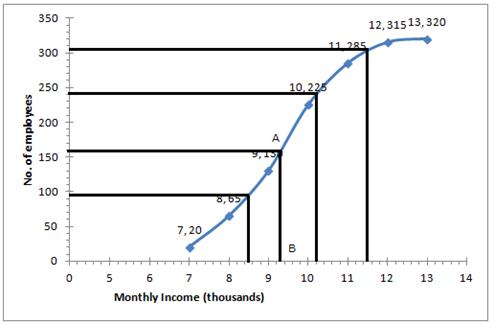
(i) ![]()
Through mark 160, draw a parallel line to x-axis which meets the curve at A, From A draw a perpendicular to x-axis meeting it at B.
The value of point B is the median = Rs 9.3 thousands
(ii) The number of employees with income below Rs 8500 = 95 (approx from the graph)
(iii) Number of employees with income below Rs 11500 = 305 (approx from the graph)
Therefore number of employees (senior employees) = 320-305 =15
(iv) Upper quartile = ![]()
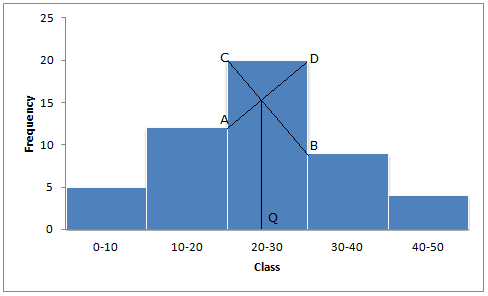
Solution 12
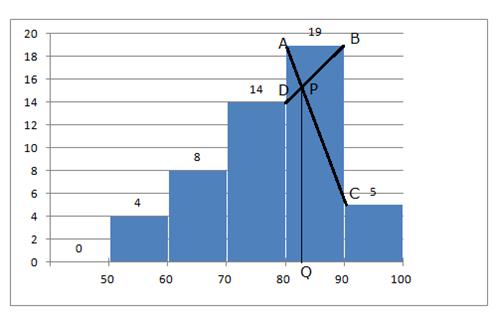
(i)Draw the histogram
(ii) In the highest rectangle which represents modal class draw two lines AC and BD intersecting at P.
(iii) From P, draw a perpendicular to x-axis meeting at Q.
(iv) Value of Q is the mode = 82 (approx)
Solution 13
|
Marks |
No. of students
|
Cumulative frequency |
|
0-10 |
5 |
5 |
|
10-20 |
11 |
16 |
|
20-30 |
10 |
26 |
|
30-40 |
20 |
46 |
|
40-50 |
28 |
74 |
|
50-60 |
37 |
111 |
|
60-70 |
40 |
151 |
|
70-80 |
29 |
180 |
|
80-90 |
14 |
194 |
|
90-100 |
6 |
200 |
Number of students = 200
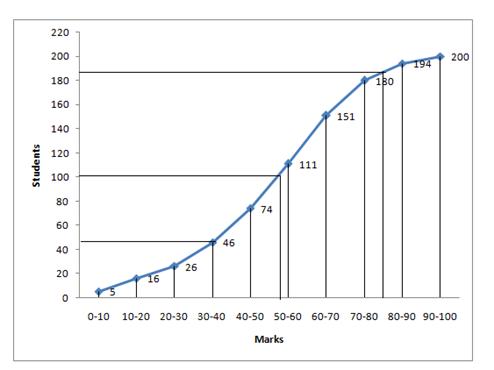
(i) ![]()
Through mark 100, draw a parallel line to x-axis which meets the curve at A, From A draw a perpendicular to x-axis meeting it at B.
The value of point B is the median = 57 marks (approx)
(ii) The number of students who failed (if minimum marks required to pass is 40)= 46 (approx from the graph)
(iii) The number of students who secured grade one in the examination = 200 - 188 = 12 (approx from the graph)
Solution 14

Solution 15
Since the frequency for x = 14 is maximum.
So Mode = 14.


According to the table it can be observed that the value of x from the 13th term to the 17th term is 13.
So the median = 13.
Solution 16

Solution 17

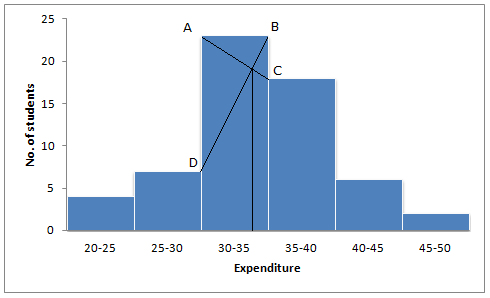
Solution 18
Histogram is as follows:
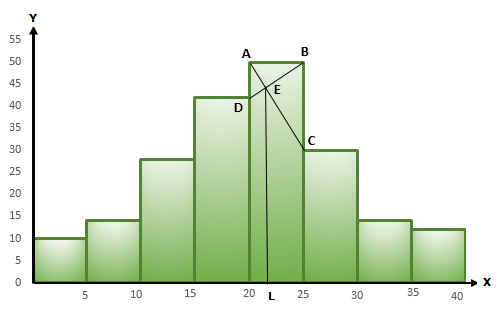
In the highest rectangle which represents modal class draw two lines AC and BD intersecting at E.
From E, draw a perpendicular to x-axis meeting at L.
Value of L is the mode. Hence, mode = 21.5
Solution 19
|
Marks |
Number of students (Frequency) |
Cumulative Frequency |
|
0-10 |
3 |
3 |
|
10-20 |
7 |
10 |
|
20-30 |
12 |
22 |
|
30-40 |
17 |
39 |
|
40-50 |
23 |
62 |
|
50-60 |
14 |
76 |
|
60-70 |
9 |
85 |
|
70-80 |
6 |
91 |
|
80-90 |
5 |
96 |
|
90-100 |
4 |
100 |
The ogive is as follows:

Solution 20
![]()

Solution 21
Here the number of observations i. e is 10, which is even.'
So, the given data is 13, 35, 43, 46, 46, 50, 55, 61, 71, 80.
In the given data, 46 occurs most frequently.
∴ Mode = 46
Solution 22
The cumulative frequency table of the given distribution is as follows:
|
Wages (Rs.) |
Upper limit |
No. of workers |
C.f. |
|
400-450 |
450 |
2 |
2 |
|
450-500 |
500 |
6 |
8 |
|
500-550 |
550 |
12 |
20 |
|
550-600 |
600 |
18 |
38 |
|
600-650 |
650 |
24 |
62 |
|
650-700 |
700 |
13 |
75 |
|
700-750 |
750 |
5 |
80 |
The ogive is as follows:
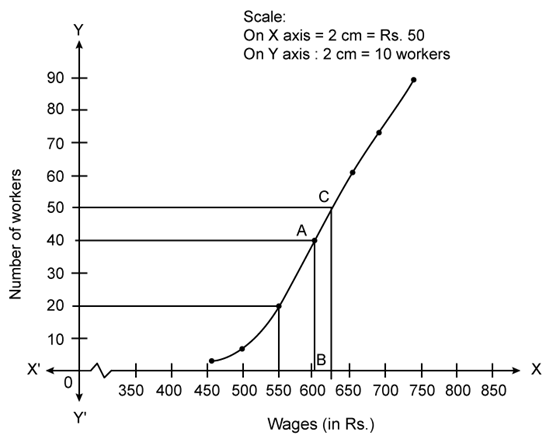
Number of workers = n = 80
1) Median = ![]() term = 40th term, draw a horizontal line which
meets the curve at point A.
term = 40th term, draw a horizontal line which
meets the curve at point A.
Draw vertical line parallel to y axis from A to meet x axis at B.
The value of point B is 605.
2) Lower quartile
(Q1)= ![]() term=20th term = 550
term=20th term = 550
3) Through mark of point 625 on x axis draw a vertical line which meets the graph at point C Then through point C, draw a horizontal line which meets the y axis at the mark of 50.
Thus, the number of workers that earn more than Rs. 625 daily = 80 - 50 = 30
Solution 23
i. The frequency distribution table is as follows:
|
Class interval |
Frequency |
|
0-10 |
2 |
|
10- 20 |
5 |
|
20-30 |
8 |
|
30-40 |
4 |
|
40-50 |
6 |
ii.
|
Class interval |
Frequency (f) |
Mean value (x) |
fx |
|
0-10 |
2 |
5 |
10 |
|
10- 20 |
5 |
15 |
75 |
|
20-30 |
8 |
25 |
200 |
|
30-40 |
4 |
35 |
140 |
|
40-50 |
6 |
45 |
270 |
|
|
Sf = 25 |
|
Sf = 695 |
![]()
iii. Here the maximum frequency is 8 which is corresponding to class 20 - 30.
Hence, the modal class is 20 - 30.
